ECG Description and Analysis
1. Is it narrow or wide complex tachycardia?
2. Is it regular or irregular?
3. Where is the P-wave (before the QRS, within the QRS -thus impossible to be identified-, or after the QRS)?
The ECG is:
Let’s Analyze Case 11
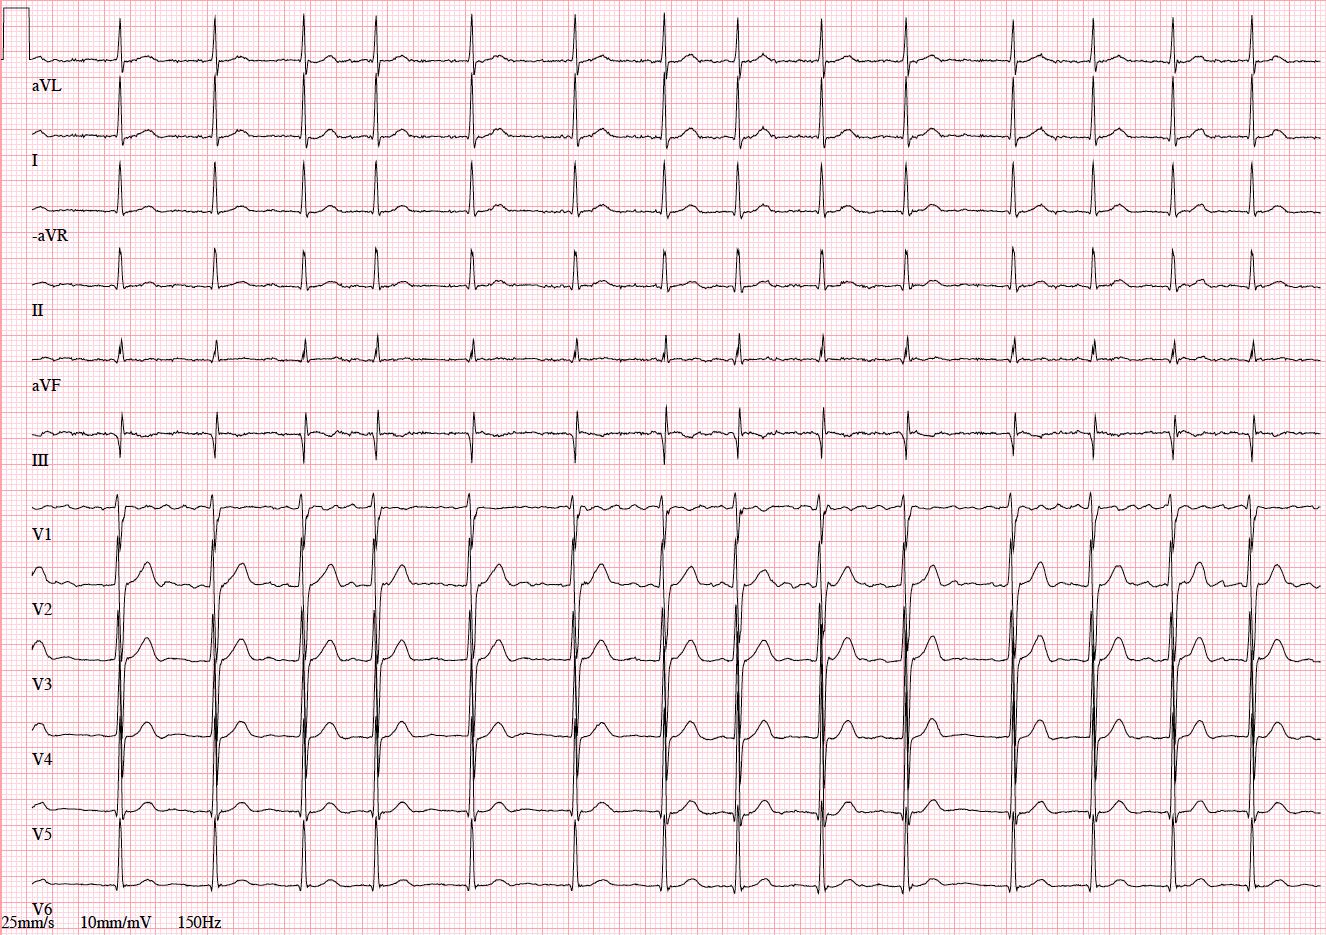
This is a narrow QRS tachycardia, which indicates that arrhythmia mechanism is located above the level of His bundle and the arrhythmia is supraventricular.
RR intervals are irregular, which may indicate either:
(1) variability of atrio-ventricular conduction during regular supraventricular tachycardia (such as rapid atrial tachycardia or atrial flutter with variable AV conduction) or
(2) rapid and irregular atrial rhythm.
In the first case, one would expect to observe some sort of system in the RR intervals or “regularly irregular” rhythm caused by variable 2:1, 3:2, 4:3 etc conduction and visible regular atrial activity during RR intervals, especially those of longer duration.
The ECG presented in the figure, however, does not meet this description.
RR intervals are apparently chaotic or “irregularly irregular” and no regular atrial activity can be observed between QRS complexes.
This excludes diagnosis of atrial flutter or atrial tachycardia with variable AV conduction.
There are no visible reproducible P waves between QRS complexes.
One can note baseline fluctuations confined to the right precordial leads V1 and V2, which represent irregular, variable, and rapid atrial activity typical for atrial fibrillation.
Being unipolar and located in the vicinity of the right atrial appendage adjacent to the chest wall, right precordial leads may show atrial activity during atrial fibrillation even in cases when small amplitude fibrillatory waves become nearly invisible in other leads.
Exercise Based on Case 11
1. Use your calipers to determine the exact heart rate corresponding to the shortest and the longest RR interval.
2. Calculate mean ventricular rate without using calipers (Hint: duration of the snapshot ECG recording is 10 sec).
3. Use your calipers to estimate the frequency of atrial activity from lead V1 using the longest RR intervals with visible fibrillatory waves.